What's in my Location History?
Getting my location history from Google and analyzing it with Python.

In May 2025, Google announced that location data would no longer be stored on their servers. It’s now stored on the device and only sent to Google in an encrypted form. This means that the Google Takeout export doesn’t contain location data anymore. It’s still possible to export the data from the device, but it only contains the raw location data, not the “semantic” one that used to be available and is used here. Therefore, the parts about the “Semantic Location History” are now obsolete forever. The rest of the article is still relevant, though.
I’ve been using Google Maps’ location history feature for a few years now. It’s a bit creepy to think about how much data Google has about me, but it’s also a goldmine for data analysis.
Kindly enough, Google allows me to download all of my precious data in machine-readable format using Takeout:

This gives us a bunch of JSON files:
1
2
3
4
5
6
7
8
9
10
11
12
13
14
15
$ ls -R
.:
 Records.json  'Semantic Location History'   Settings.json  'Timeline Edits.json'

'./Semantic Location History':
2012  2015  2017  2019  2021  2023
2014  2016  2018  2020  2022  2024

'./Semantic Location History/2012':
2012_SEPTEMBER.json

'./Semantic Location History/2014':
2014_APRIL.json  2014_DECEMBER.json  2014_MAY.json

...
First look at the data
That first Records.json file here is almost a gigabyte for my account. Not surprising, given that it contains 10-odd years of location data. It contains every single “phone home” location data packet that my phone has sent to Google.
Unprocessed data
Here’s a packet from it:
1
2
3
4
5
6
7
8
9
10
11
12
13
14
15
16
17
18
19
{
    "latitudeE7": 460734187,
    "longitudeE7": 67312122,
    "accuracy": 3198,
    "activity": [
        {
            "activity": [
                {
                    "type": "STILL",
                    "confidence": 100
                }
            ],
            "timestamp": "2014-04-28T12:34:46.342Z"
        }
    ],
    "source": "CELL",
    "deviceTag": 803364441,
    "timestamp": "2014-04-28T12:30:55.424Z"
}
This one doesn’t contain much information because it’s quite old; it was sent from the phone I had back then (a budget Wiko Lenny) and it seems like they didn’t measure as much stuff as they do now.
Here’s a more recent packet:
1
2
3
4
5
6
7
8
9
10
11
12
13
14
15
16
17
18
19
20
21
22
23
24
25
26
27
28
29
30
31
32
33
34
35
36
37
38
39
40
41
42
43
44
45
46
47
48
49
50
51
52
53
54
55
56
57
58
59
60
61
62
63
64
65
66
67
68
69
70
71
72
73
74
75
76
77
78
79
80
{
    "latitudeE7": 506444929,
    "longitudeE7": 30775562,
    "accuracy": 22,
    "altitude": 76,
    "verticalAccuracy": 3,
    "activity": [
        {
            "activity": [
                {
                    "type": "ON_FOOT",
                    "confidence": 80
                },
                {
                    "type": "WALKING",
                    "confidence": 80
                },
                {
                    "type": "IN_VEHICLE",
                    "confidence": 6
                },
                {
                    "type": "ON_BICYCLE",
                    "confidence": 6
                },
                {
                    "type": "IN_ROAD_VEHICLE",
                    "confidence": 6
                },
                {
                    "type": "IN_RAIL_VEHICLE",
                    "confidence": 6
                },
                {
                    "type": "RUNNING",
                    "confidence": 2
                },
                {
                    "type": "UNKNOWN",
                    "confidence": 0
                }
            ],
            "timestamp": "2024-03-21T17:42:26.290Z"
        }
    ],
    "source": "WIFI",
    "deviceTag": 123456,
    "platformType": "ANDROID",
    "activeWifiScan": {
        "accessPoints": [
            {
                "mac": "xxxxxx237234444",
                "strength": -80,
                "isConnected": true,
                "frequencyMhz": 0
            },
            {
                "mac": "xxxxxx237222816",
                "strength": -85,
                "frequencyMhz": 0
            },
            {
                "mac": "xxxxxx559068245",
                "strength": -88,
                "frequencyMhz": 0
            },
            {
                "mac": "xxxxxx759298638",
                "strength": -89,
                "frequencyMhz": 0
            }
        ]
    },
    "osLevel": 34,
    "serverTimestamp": "2024-03-21T17:44:37.220Z",
    "deviceTimestamp": "2024-03-21T17:44:38.992Z",
    "batteryCharging": false,
    "formFactor": "PHONE",
    "timestamp": "2024-03-21T17:42:29.183Z"
}
It only contains data processed locally on the phone. We can see it tried to guess what I was doing, and also sent a list of nearby Wi-Fi networks.
Processed data
The aptly named Semantic Location History folder contains the Google-processed data. Notably, it contains both place visits, that describe places I was, and activity segments, that describe things I did over a period of time. Here are two packets from the same time period as the one above:
1
2
3
4
5
6
7
8
9
10
11
12
13
14
15
16
17
18
19
20
21
22
23
24
25
26
27
28
29
30
31
32
33
34
35
36
37
38
39
40
41
42
43
44
45
46
47
48
49
50
51
52
53
54
55
56
57
58
59
60
61
62
63
64
65
66
67
68
69
70
71
72
73
74
75
76
77
78
79
80
81
82
83
84
85
86
87
88
89
90
91
92
93
94
95
96
97
98
99
100
101
102
103
104
105
106
107
108
109
110
111
112
113
114
115
116
117
118
119
120
121
122
123
124
125
126
127
128
129
130
131
132
133
134
135
136
137
138
139
140
141
142
143
144
145
146
147
148
149
150
151
152
153
154
155
156
157
158
159
160
161
162
163
164
165
166
167
168
169
170
171
172
173
174
175
176
177
178
179
180
181
182
183
184
185
{
    "placeVisit": {
        "location": {
            "latitudeE7": 506443503,
            "longitudeE7": 30774789,
            "placeId": "ChIJD-fhtSEqw0cRkCuIhwJPMx8",
            "address": "147 Rue du Ballon, 59110 La Madeleine, France",
            "name": "Nexedi",
            "semanticType": "TYPE_UNKNOWN",
            "sourceInfo": {
                "deviceTag": 850787795
            },
            "locationConfidence": 46.95392,
            "calibratedProbability": 46.95392
        },
        "duration": {
            "startTimestamp": "2024-03-20T18:36:21Z",
            "endTimestamp": "2024-03-21T17:42:24Z"
        },
        "placeConfidence": "MEDIUM_CONFIDENCE",
        "visitConfidence": 99,
        "otherCandidateLocations": [
            {
                "latitudeE7": 506442688,
                "longitudeE7": 30772597,
                "placeId": "ChIJt-gKoQwqw0cR_BiE7FjE1sM",
                "address": "34 Av. Verdi, 59110 La Madeleine, France",
                "semanticType": "TYPE_SEARCHED_ADDRESS",
                "locationConfidence": 45.081074,
                "calibratedProbability": 45.081074
            },
            {
                "latitudeE7": 506443473,
                "longitudeE7": 30774441,
                "placeId": "ChIJW0n_oQwqw0cRLSCoT36NyAY",
                "address": "147 Rue du Ballon, 59110 La Madeleine, France",
                "semanticType": "TYPE_UNKNOWN",
                "locationConfidence": 7.4105234,
                "calibratedProbability": 7.4105234
            },
            {
                "latitudeE7": 506445560,
                "longitudeE7": 30775986,
                "placeId": "ChIJy6IzmAwqw0cRyUwotTJRo8M",
                "address": "48 Av. Louise, 59110 La Madeleine, France",
                "semanticType": "TYPE_UNKNOWN",
                "locationConfidence": 0.20785488,
                "calibratedProbability": 0.20785488
            },
            "/* many others */"
        ],
        "editConfirmationStatus": "NOT_CONFIRMED",
        "locationConfidence": 47,
        "placeVisitType": "SINGLE_PLACE",
        "placeVisitImportance": "MAIN"
    }
}
{
    "activitySegment": {
        "startLocation": {
            "latitudeE7": 506452913,
            "longitudeE7": 30765453,
            "sourceInfo": {
                "deviceTag": 850787795
            }
        },
        "endLocation": {
            "latitudeE7": 506525419,
            "longitudeE7": 30805372,
            "sourceInfo": {
                "deviceTag": 850787795
            }
        },
        "duration": {
            "startTimestamp": "2024-03-21T17:42:24Z",
            "endTimestamp": "2024-03-21T17:54:24Z"
        },
        "distance": 973,
        "activityType": "WALKING",
        "confidence": "HIGH",
        "activities": [
            {
                "activityType": "WALKING",
                "probability": 97.82699942588806
            },
            {
                "activityType": "IN_TRAM",
                "probability": 0.5118888337165117
            },
            {
                "activityType": "IN_PASSENGER_VEHICLE",
                "probability": 0.27286421973258257
            },
            {
                "activityType": "CYCLING",
                "probability": 0.17150864005088806
            },
            {
                "activityType": "IN_TRAIN",
                "probability": 0.1608503283932805
            },
            {
                "activityType": "IN_SUBWAY",
                "probability": 0.10802004253491759
            },
            {
                "activityType": "IN_BUS",
                "probability": 0.08674889104440808
            },
            {
                "activityType": "RUNNING",
                "probability": 0.07946699624881148
            },
            {
                "activityType": "IN_FERRY",
                "probability": 0.04058652848470956
            },
            {
                "activityType": "SAILING",
                "probability": 0.005038841118221171
            },
            {
                "activityType": "MOTORCYCLING",
                "probability": 0.0035849196137860417
            },
            {
                "activityType": "SKIING",
                "probability": 0.0032918462238740176
            },
            {
                "activityType": "FLYING",
                "probability": 9.03989166545216E-4
            }
        ],
        "waypointPath": {
            "waypoints": [
                {
                    "latE7": 506444816,
                    "lngE7": 30776507
                },
                {
                    "latE7": 506459426,
                    "lngE7": 30749950
                },
                {
                    "latE7": 506460113,
                    "lngE7": 30750701
                },
                {
                    "latE7": 506521911,
                    "lngE7": 30811212
                },
                {
                    "latE7": 506525421,
                    "lngE7": 30805346
                }
            ],
            "source": "INFERRED",
            "roadSegment": [
                {
                    "placeId": "ChIJG9zengwqw0cRnoAeiorlC5U",
                    "duration": "8s"
                },
                {
                    "placeId": "ChIJHYTkuwwqw0cRwMDf0gLaefA",
                    "duration": "71s"
                },
                "/* many others */"
            ],
            "distanceMeters": 1175.9853099670709,
            "travelMode": "WALK",
            "confidence": 0.9999485583582982
        },
        "simplifiedRawPath": {
            "points": [
                {
                    "latE7": 506459770,
                    "lngE7": 30751483,
                    "accuracyMeters": 6,
                    "timestamp": "2024-03-21T17:45:19.542Z"
                }
            ]
        }
    }
}
Here, the gremlins inside Google’s servers have managed to deduce from the periodic location data sent by my phone that I was at the office for a bit more than a day (I was sleeping in the office bedroom that week), and that I walked somewhere. Indeed, I was on my way to the sixth edition of the Rust Lille meetup!
Adding Google Fit to the mix
I also happen to use Google Fit on my phone to track my physical activity. Fit uses the phone’s internal accelerometer and step counter to more accurately track the details of my walks. It uses the GPS like Maps, but more processing is done locally, and the sensors help make more sense of the recorded data.
I downloaded the Fit data from Takeout, this time it’s in a different format:
1
2
3
4
5
6
7
$ ls | head
2018-10-28T14_30_31.734+01_00_PT22M11.176S_Marche_.tcx
2018-10-31T11_06_19.466+01_00_PT13M22.611S_Marche_.tcx
2018-11-01T19_24_54.616+01_00_PT20M9.73S_Marche à_.tcx
2018-11-03T09_59_04.525+01_00_PT23M3.316S_Marche à.tcx
2018-11-03T11_05_37.903+01_00_PT23M23.153S_Marche_.tcx
...
TCX is an open format for fitness data. It’s a bit more concise than the Location History data:
1
2
3
4
5
6
7
8
9
10
11
12
13
14
15
16
17
18
19
20
21
22
23
24
25
26
27
28
29
30
31
32
33
34
35
36
37
38
39
40
41
42
43
44
45
46
47
48
49
50
51
52
53
54
55
56
57
58
59
60
61
62
63
<?xml version="1.0" encoding="UTF-8"?>
<TrainingCenterDatabase
    xmlns="http://www.garmin.com/xmlschemas/TrainingCenterDatabase/v2"
    xmlns:ns2="http://www.garmin.com/xmlschemas/UserProfile/v2"
    xmlns:ns3="http://www.garmin.com/xmlschemas/ActivityExtension/v2"
    xmlns:ns4="http://www.garmin.com/xmlschemas/ProfileExtension/v1"
    xmlns:ns5="http://www.garmin.com/xmlschemas/ActivityGoals/v1"
    xmlns:xsi="http://www.w3.org/2001/XMLSchema-instance" xsi:schemaLocation="http://www.garmin.com/xmlschemas/TrainingCenterDatabase/v2 http://www.garmin.com/xmlschemas/TrainingCenterDatabasev2.xsd">
    <Activities>
        <Activity Sport="Walking">
            <Id>2024-03-21T17:44:50.622Z</Id>
            <Lap StartTime="2024-03-21T17:44:50.622Z">
                <Track>
                    <Trackpoint>
                        <DistanceMeters>0.0</DistanceMeters>
                        <Time>2024-03-21T17:44:50.622Z</Time>
                    </Trackpoint>
                    <Trackpoint>
                        <DistanceMeters>16.5991829017131</DistanceMeters>
                        <Time>2024-03-21T17:44:51.050Z</Time>
                        <Position>
                            <LatitudeDegrees>50.645694732666016</LatitudeDegrees>
                            <LongitudeDegrees>3.0756449699401855</LongitudeDegrees>
                        </Position>
                        <AltitudeMeters>71.0</AltitudeMeters>
                    </Trackpoint>
                    <!-- many more -->
                    <Trackpoint>
                        <DistanceMeters>1157.9140959867575</DistanceMeters>
                        <Time>2024-03-21T17:56:05.043Z</Time>
                        <Position>
                            <LatitudeDegrees>50.65315246582031</LatitudeDegrees>
                            <LongitudeDegrees>3.0800328254699707</LongitudeDegrees>
                        </Position>
                        <AltitudeMeters>85.20000457763672</AltitudeMeters>
                    </Trackpoint>
                    <Trackpoint>
                        <DistanceMeters>1157.9140959867575</DistanceMeters>
                        <Time>2024-03-21T17:56:06.272Z</Time>
                    </Trackpoint>
                </Track>
                <DistanceMeters>1157.9140959867575</DistanceMeters>
                <TotalTimeSeconds>675.65</TotalTimeSeconds>
                <Calories>40.936883866013424</Calories>
                <Intensity>Active</Intensity>
                <TriggerMethod>Manual</TriggerMethod>
            </Lap>
        </Activity>
    </Activities>
    <Author xsi:type="Application_t">
        <Name>Google Fit</Name>
        <Build>
            <Version>
                <VersionMajor>0</VersionMajor>
                <VersionMinor>0</VersionMinor>
                <BuildMajor>0</BuildMajor>
                <BuildMinor>0</BuildMinor>
            </Version>
        </Build>
        <LangID>en</LangID>
        <PartNumber>000-00000-00</PartNumber>
    </Author>
</TrainingCenterDatabase>
Already there are small differences between Maps and Fit. Maps recorded a single walk activity but Fit cut it in two activities. The previous Fit activity isn’t shown above, but I can tell you Fit thinks I walked 1193 meters while Maps says 1175 meters. We’ll compare both of their datasets below.
Processing it with Python
I wrote a simple Python script that parses the JSON, aggregates the data in multiple fun ways, and outputs it to JSON files I can use as charts on this blog (try viewing the page source!).
Measuring my walking speed
The most obvious measure for a dataset is often the average. As a disclaimer, I filtered walks that indicated a walking speed of more than 15 km/h (I’m not that good of an athlete) and less than 1 km/h (I’m not that slow of a walker).
Binned and histogrammed, the data looks like this:
The average measured walking speed is 3.90 km/h (median 3.94 km/h), that is, close enough to the 5 km/h figure that is often used as a rule of thumb for walking speed for an adult human. High-passing above 2 or 3 km/h (which are realistic speeds for walking) would contribute to make the average closer to 5 km/h.
The data isn’t perfect by any means, we can see a long tail of fast walks on the right that we can attribute to me running to catch my bus, and a few slow walks on the left that are probably me walking around the house. And that’s without accounting for the fact that the data is only from when I had my phone on me, which is true most of the time but not always. Plus, it’s only what the algorithms have deduced from periodic position data!
Measuring my walking distance over time
Grouping walks by month and summing the distance gives us this lovely chart that I’ve labelled with what I was doing at the time:
Here, I’ve grouped batches of 12 months by the academic year they belong to, instead of the calendar year. The rationale is that for those years, my life was mostly structured by the academic year, from September to August.
I walked a lot in high school, a bit less in prep school, and got to an all-time low in my second year, because of the first COVID lockdown (admittedly I was also skipping a lot of classes in the end of the year) which made us attend the last 3-4 months of class from home.
Interestingly, Maps and Fit agree for the Prep. Y1 part, but start disagreeing more and more as time passes. I’ve manually compared a few bits of data from both (comparing everything is… a bit hard) and it seems like most of the divergence can be explained by the fact that Maps is unable to measure what I’d call “internal walks”, e.g. walking in my apartment, because the GPS location doesn’t vary much. Fit, on the other hand, can measure those because it uses the phone’s accelerometer and step counter in addition to the GPS.
This hypothesis is supported by the fact that in first year I lived in a very small apartment, and then in second year there’s the lockdown, and I start walking a lot in a bigger apartment (but that’s still not bit enough for Maps to notice my movements).
Enter third year and it goes back up a bit, well, until the next lockdown, at the end of October, but this time the whole year was done remotely. Again, Maps and Fit disagree quite a lot here, and I remember that I was walking circles often in my apartment during that year to help me think.
Fourth and fifth year were pretty normal, and then around half of fifth year I started interning and then this year, working (remotely, so again, disagreement between Maps and Fit).
We can get a bit more granular and look at the monthly distance walked. Here I’ve labelled specific periods of time that explain some of the peaks and valleys:
Other Fun Things
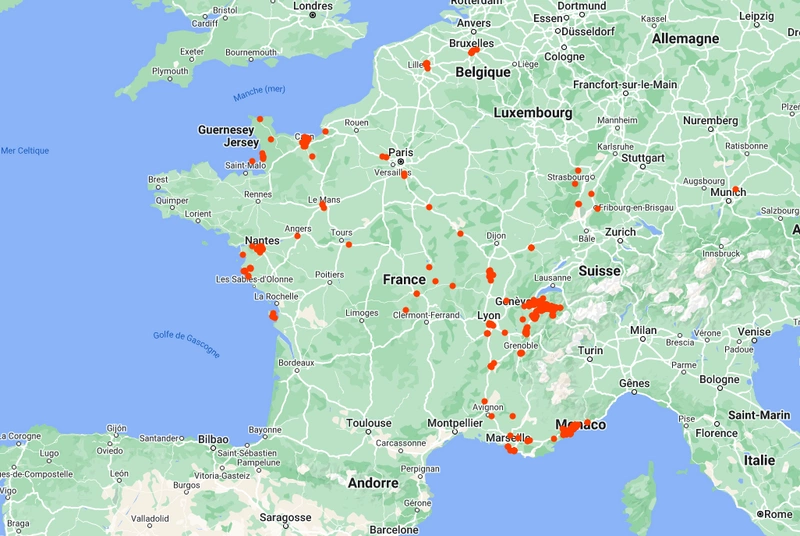
I found a nice app that generates heat maps (literal maps) from Takeout location data. Behold, 10 years of my life as a map:
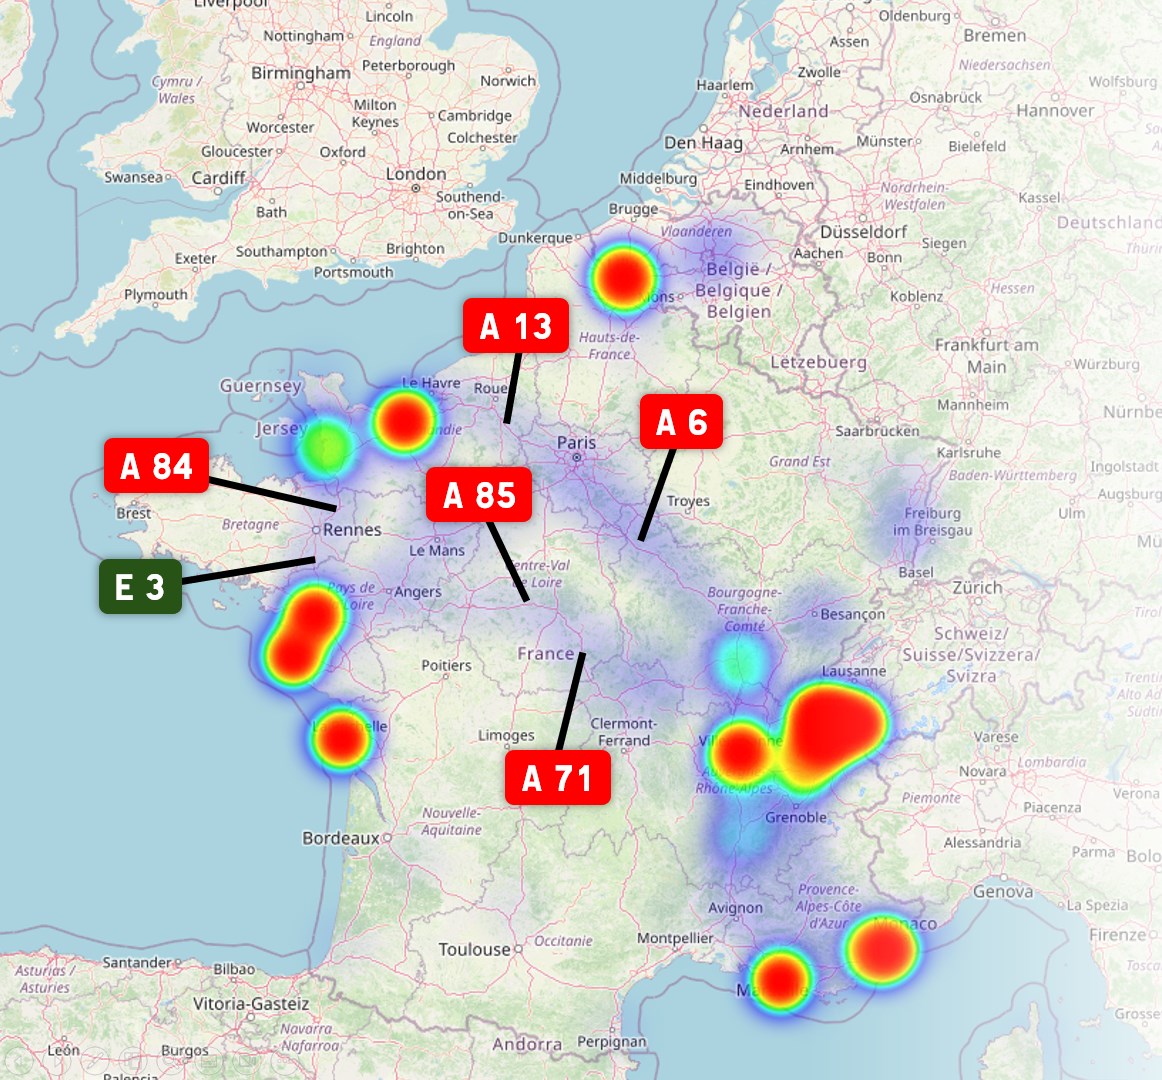
There’s something really interesting here that emerges from the data. Of course, the places where I spent the more time are red blobs, but if you look closely you can see cloud-like structures between major areas, that extend along long paths. These are places I visited enough times that they show up on the map, but at the same time, are all close to each other… Well, they’re simply the major highways I’ve taken while traveling by car! I’ve added their names in boxes next to the “clouds”.